
13/04/2026

Inflation is one of those economic terms that appears constantly in the news but is rarely explained clearly. Yet it shapes almost every financial decision we make, how far our salary stretches, whether our savings are really growing, and how much investment risk we need to take over time.
At its simplest, inflation is the gradual rise in the price of goods and services. When inflation exists, each pound buys less than it did before. That loss may feel subtle from one year to the next, but over decades it becomes impossible to ignore.
A simple way to think about it
Imagine a weekly shop that costs £200 today. If inflation runs at 2%, that same shop costs £204 next year. At 5%, it becomes £210. At 10%, it jumps to £220. Stretch that forward 20 or 30 years and the cumulative effect is dramatic. Inflation is not about prices occasionally rising; it is about the long-term erosion of what money can buy.
The stamp that tells the story
One of the clearest illustrations of inflation is the first-class postage stamp:
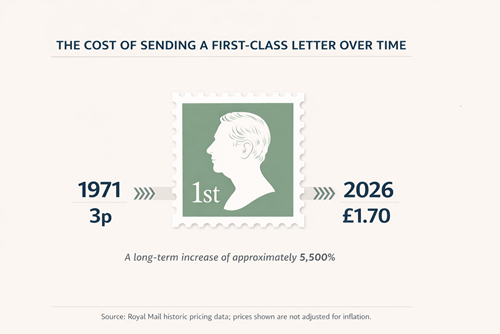
Its job has not changed: it sends a standard letter anywhere in the UK, typically arriving the next working day. It has not become faster, smarter, or better in any meaningful way. Yet the price tells a powerful story. In 1971, a first-class stamp cost 3p. By 2000, it was 27p. By April 2025, it had reached £1.70, an increase of over 5,500% since decimalisation, for a product whose function is identical.
If someone had put 3p in a drawer in 1971, it would still be worth 3p today. But to buy the same stamp, doing the same job, they would now need £1.70. The money did not change; its buying power did.
The same pattern appears across everyday life. Energy bills that once cost a few hundred pounds a year have, for many households, risen into the thousands. A cup of coffee that cost £2 a decade ago now commonly costs £3.50 or more. Average UK house prices, which sat around £70,000 in the late 1990s, now stand at approximately £270,000. These are not lifestyle changes, they are concrete evidence of money losing value over time.
How inflation is measured
In the UK, inflation is primarily tracked using the Consumer Prices Index (CPI), produced by the Office for National Statistics. CPI monitors the price changes of a broad ‘basket’ of goods and services, food and drink, energy bills, transport, clothing, entertainment, and subscriptions, updated regularly to reflect how people actually live. Each item is weighted by its share of the average household budget, so energy costs have a far greater impact on the index than cinema tickets.
There are, however, three main measures, each serving a slightly different purpose.
- CPI is the internationally comparable headline measure and the one the Bank of England targets when setting interest rates, with a long-term target of 2%. It does not include most housing costs.
- CPIH builds on CPI by adding owner-occupiers’ housing costs and council tax, using a rental equivalence approach. Because housing is one of the largest expenses for most households, CPIH is considered the most comprehensive measure and has been the ONS’s preferred headline measure since 2017.
- RPI, the oldest measure, includes mortgage interest payments but uses an outdated calculation method the ONS has confirmed does not meet modern statistical standards. It is no longer classified as an official National Statistic, though it remains embedded in legacy contracts, some pensions, rail fares, and index-linked gilts — and typically shows a higher inflation rate than CPI or CPIH.
No single index perfectly captures everyone’s experience of rising prices. An individual’s personal inflation rate depends on their own spending patterns, and for those who spend heavily on energy or housing it can differ significantly from the headline figure.
Inflation is not a new problem
It is tempting to think of inflation as a recent concern, but history tells a different story. In the 1970s, UK inflation surged dramatically, peaking at around 22–25% in 1975. Prices more than doubled in just a few years.
Even during more stable periods, inflation has continued its quiet work. Since the early 1990s, UK inflation has averaged around 2–3% per year. More recently, following the pandemic and energy price shocks driven in part by the war in Ukraine, CPI inflation rose sharply again, peaking at 11.1% in October 2022 — the highest level in over 40 years.
The lesson is consistent: inflation is persistent, unpredictable, and powerful.
Why inflation matters more than savings rates
This is where inflation becomes particularly important for savers. If a savings account pays 3% interest but inflation is running at 5%, the real value of that money is falling by 2% every year, even though the balance on the statement is rising. This is known as a negative real return, and it represents one of the biggest hidden risks for those who rely heavily on cash over the long term.
Cash feels safe because its value does not fluctuate day to day. But in inflationary terms, cash carries a very real risk: a gradual, near-certain erosion of purchasing power.
The case for taking investment risk
This is why inflation sits at the heart of long-term financial planning. To maintain — and ideally grow — a standard of living over time, money needs to grow faster than inflation after tax. Historically, this has required exposure to assets such as company shares (equities), property, infrastructure, and other real assets that can increase in price alongside inflation.
These assets are not risk-free. Their values can fluctuate sharply in the short-term. But over long periods they have tended to outpace inflation, whereas cash has consistently struggled to do so.
Put simply: cash protects capital in the short term. Growth assets protect purchasing power in the long term. Avoiding investment risk entirely often means accepting inflation risk instead.
The 25-year reality test
A retirement lasting 25 years is long enough for inflation to become one of the most powerful forces acting on a financial plan. Even at modest levels, it compounds relentlessly. Using long-run historical UK data, £100 exposed purely to inflation would need to grow to more than £260 simply to buy the same basket of goods a quarter-century later.
Cash has historically grown slightly faster than prices, but only just — £100 in cash would have grown to roughly £300 in nominal terms over the same period, representing only a modest improvement in real spending power. Cash has tended to preserve value rather than meaningfully grow it.
Equities tell a very different story. Despite their volatility, they have historically delivered substantially higher returns over multi-decade periods. Using the same long-run averages, £100 invested in equities over 25 years would have grown to well over £800. The journey would not have been smooth — there would have been sharp falls and uncomfortable uncertainty along the way — but the long-term outcome has historically been very different from cash.
This is the core trade-off in long-term investing: accepting short-term volatility in exchange for a higher probability of preserving and growing spending power.
Over a retirement-length time horizon, the greatest risk is often not market fluctuations — it is the quiet certainty of inflation steadily eroding what money can buy. Accepting some level of investment risk is therefore not about chasing returns; it is about giving money a realistic chance of maintaining its role in supporting a desired standard of living over many years.
If your money does not grow, your lifestyle will eventually shrink. That is why inflation matters — and why, for most long-term goals, accepting some level of investment risk is not a gamble but a necessity.
Source: What actually is inflation and why is it so important? | Crowe Financial Planning UK Limited